An Introduction to Data Analysis and Visualization in R
1. About
This workshop is designed to provide an accessible introduction to R statistical software by getting participants up and running with practical data analysis exercises. Along the way, you will learn how to transform, visualise, and analyse data in R. After the course, you will be familiar with the tools available in R to perform commonly used data analyses.
2. Curriculum
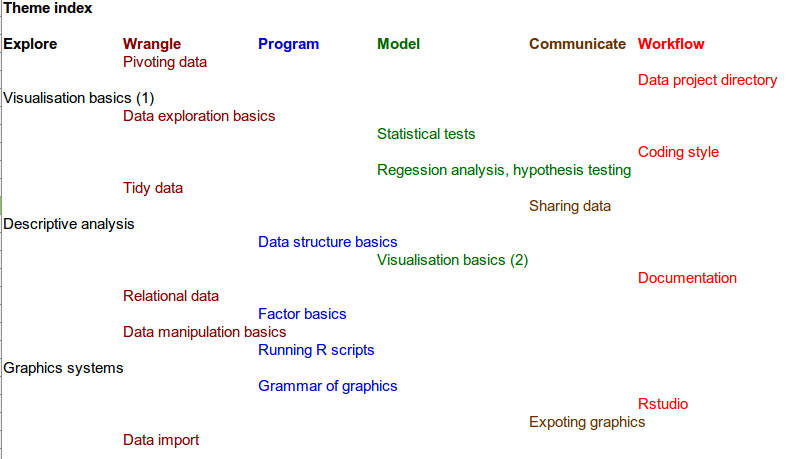
Foundations
Learn the absolute essentials of R and its ecosystems.
Brief R background, why R
RStudio basics, panes, utilities
Running R scripts, objects, functions
R packages, CRAN, Bioconductor
Getting help
R community
Data Essentials
Learn the most important data types and data structures in R.
Data import:
readrData structure basics: vectors, matrices, data frames
Factor basics
Data exploration basics
Data Manipulation
Learn to explore and properly prepare data for analysis.
Data manipulation basics,
dplyr’s sing table verbsRelational data,
dplyr’s two table verbsTidy data
Pivoting data,
tidyr’s gathering and spreading
Data Visualization
Learn to produce meaningful and beautiful data visualisation.
Graphics systems:
grid,base,ggplot2,latticeGrammar of graphics -
ggplot2Visualisation basics (1)
Exporting graphics
Data Modelling
Learn to conduct simple summary statistics and linear regression models.
Descriptive analysis with continuous and categorical variables
Statistical tests
Visualisation basics (2)
Regression analysis, hypothesis testing
Data Practices
Learn to adopt ‘good enough’ practices when using R.
Data project directory
Coding style
Documentation
Sharing data